¶ Quick Guide
Enter the https://hpc-info.kdm.wcss.pl webpage to check:
- usage status of your computational services
- CPU, GPU, disk and RAM usage by SLURM jobs
¶ HPC Info
The HPC Info service webpage: https://hpc-info.kdm.wcss.pl
The HPC Info service allows for monitoring the usage of computational resources by supercomputer users that have access to the service "Process on a supercomputer". Users have a convenient access to information such as:
- usage of CPU and GPU hours by their jobs;
- remaining amount of computing resources of the services to which the users have access to;
- detailed computer resource usage by users' jobs, such as the percentage of utilization of individual CPU cores or GPU cards over time;
- information regarding the usage of their services by other users (available only for service owners)
The data is provided using the Grafana service and has been prepared in the separate dashboards that allow interactive browsing of the collected data. Additionally, by selecting the appropriate chart, it is possible to export the data to a CSV format.
Based on the information provided through the HPC Info service, service managers should monitor how their services are being used by other users. Such information will be taken into account when reviewing requests for new services (or requests for additional resources). In case where the usage of computational resources raises concerns (for example, a large portion of resources with incorrectly completed job statuses such as CANCELLED, TIMEOUT, or OUT OF MEMORY), the request may not be accepted in its originally submitted form.
¶ Logging
Network access
The https://hpc-info.kdm.wcss.pl webpage is accessible only within the Wroclaw University of Science and Technology network or via the VPN-KDM**
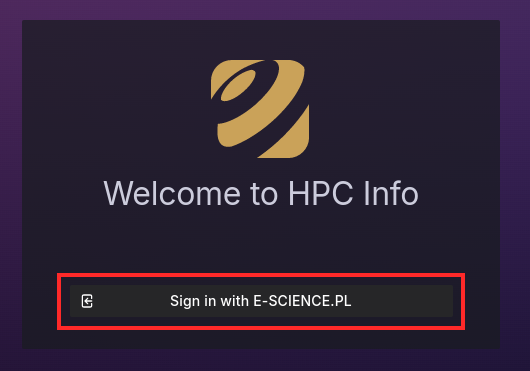
One can log in only using the E-SCIENCE.PL credentials, after clicking on the Sign in with E-SCIENCE.PL button (highlighted with a red rectangle on the picture below):
¶ Available dashboards
Users have access to several panels described in the table below. The charts and indicators are supplemented with simple descriptions that can be displayed by hovering over the (i) icon located next to the chart name. The chart formats are not modifiable, and users do not have access to other users' data.
In case of the HPC Services Usage [for Users] and HPC Services Panel [for Managers] dashboards, the information has been being gathered since 07.08.2024, except data on the total usage of CPU and GPU hours, which is equivalent to the one obtained via the service-balance command. The service owners may request an additional summary of CPU ang GPU time usage by the users for the earlier date ranges.
¶ Home page
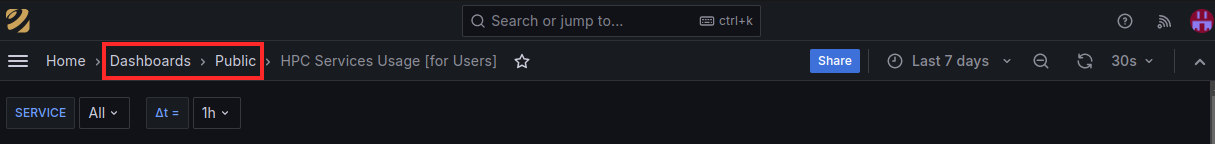
After logging in, the title page with the HPC Services Usage [for Users] dashboard (described in the table below) will be displayed. To access other available dashboards, you can use the navigation located at the top of the screen (above the currently browsed dashboards) and go to Dashboards > Public:
¶ Filters and data range selection
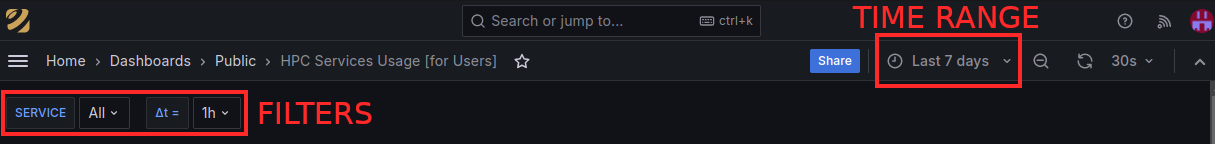
The panels include selected filters that allow choosing the dataset and reducing excess information. Additionally, in the upper right corner of the webpage, there is a dropdown menu button for selecting the time range, which only affects selected charts with an unlocked time range:
Complete time range
Charts that display a blue label, such asLast 4 years, show cumulative data covering the provided and unmodifiable time range
¶ Table of available dashboards
| Dashboard | Description | Access | Filters | Data retention time | Frequency of data gathering |
|---|---|---|---|---|---|
| Computer Resources Usage [for Users] | Dashboard with detailed information on the usage of computer resources by all user's jobs over time:
|
User |
|
31 days | ~15 sec |
| HPC Services Usage [for Users] | Dashboard with information on the overall usage of computer resources by the user, such as:
|
User |
|
4 years | ~ 5 min |
| HPC Services Panel [for Managers] | Dashboard with information on the overall usage of computer resources by all users that have access to the particular service. The service owner can access data such as:
|
Service owner |
|
4 years | ~ 5 min |
¶ Related pages
- Service Resource Usage Accounting - general information on the accounting system on WCSS supercomputer